

Tourist spending is one of the clearest signals of how Europe’s travel industry is evolving, with visitor budgets shifting across countries as travel habits change year on year. From the Mediterranean coastlines drawing high volumes of budget-conscious travelers to alpine and capital-city destinations attracting bigger per-trip spends, the numbers show that not every country benefits from tourism in the same way or to the same degree.
We’ve looked into the latest tourist spending data across EU countries to see which countries bring in the most from visitors, how much travelers are spending per trip, and how these figures have shifted in recent years.
Key statistics
- Luxembourg residents spend the most of any EU country, averaging €191 per night and €1,300 per trip, well above the EU average of €104 per night and €518 per trip.
- Residents of Greece have the lowest per-night spend in the EU at just €49, despite ranking mid-table on per-trip spending (€473), suggesting longer average trip durations.
- Total tourism expenditure across the EU reached €617.9 billion in 2024, split between €257.2 billion spent domestically and €360.7 billion spent on foreign trips.
- Germany accounts for the largest share of EU tourism spending, with €202.1 billion in total expenditure, almost double any other country.
- Malta records the lowest total tourism expenditure in the EU at €0.9 billion, broadly reflecting its small population size.
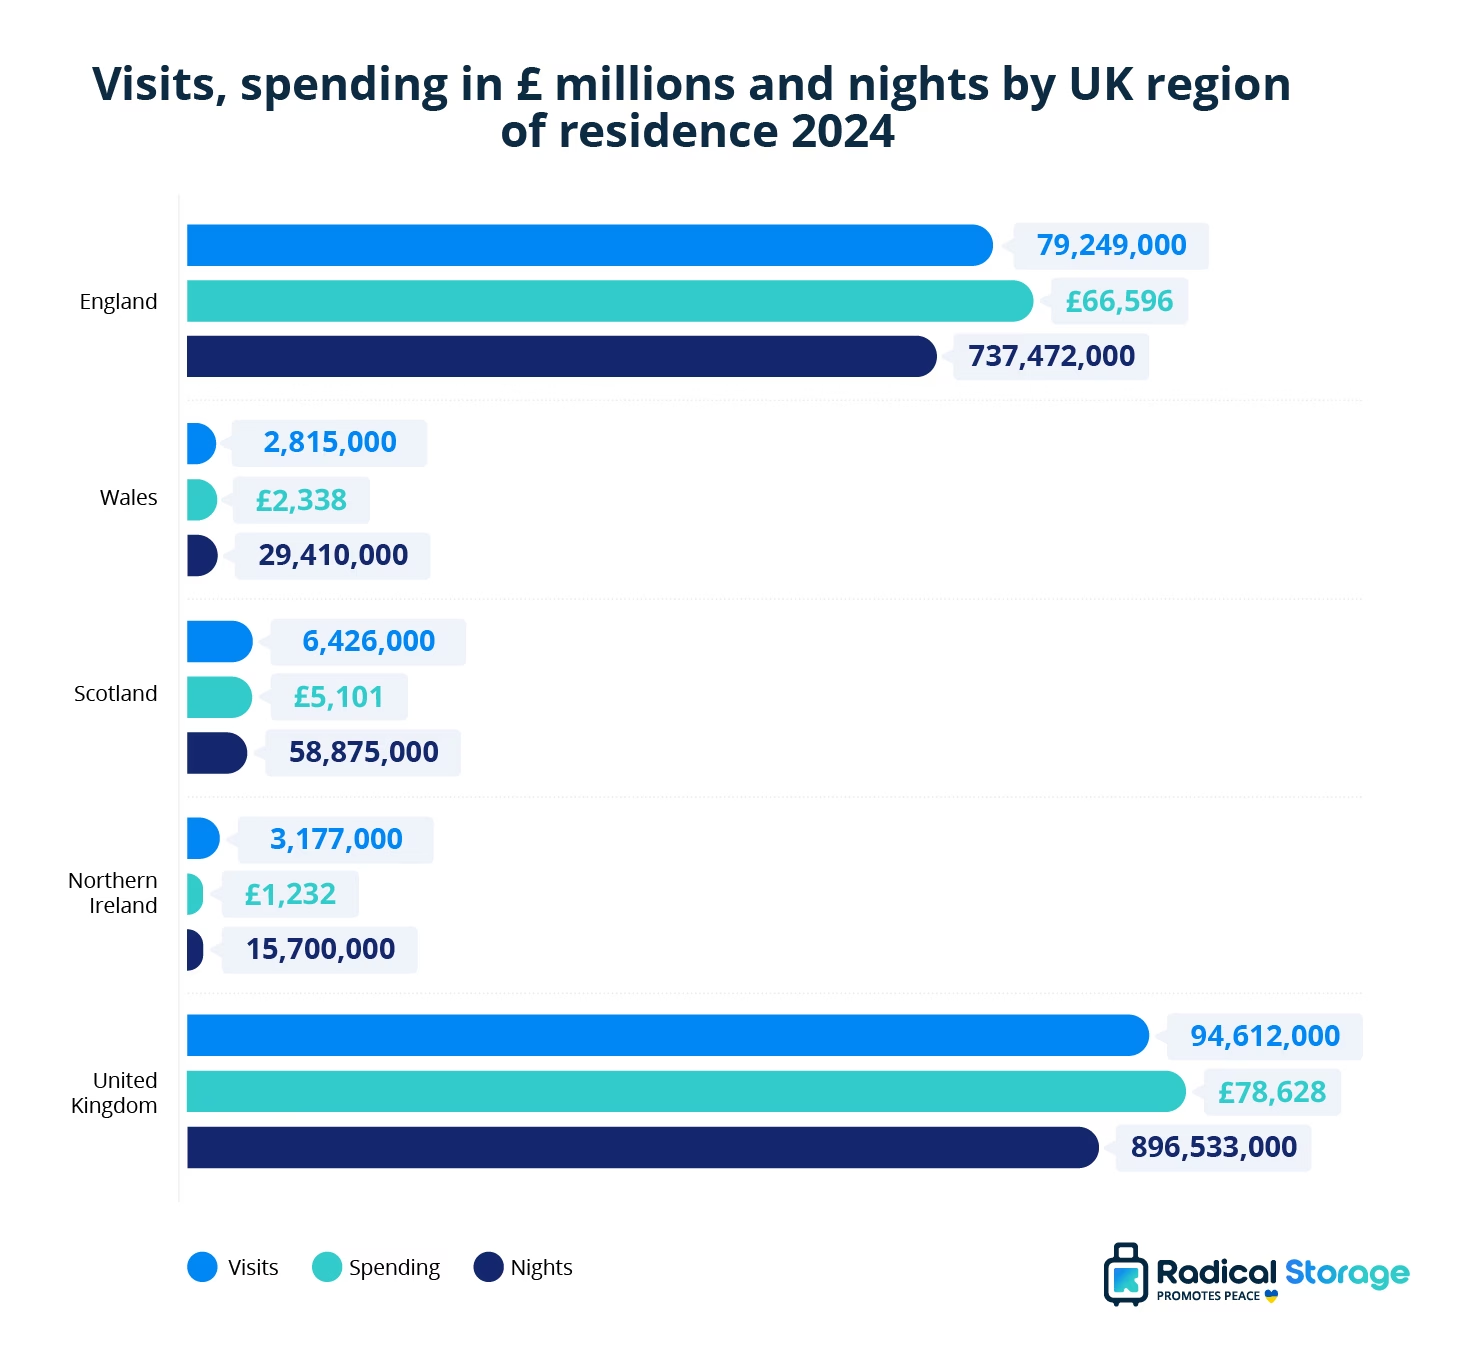
- UK residents spent £78.6 billion on trips abroad in 2024, with England alone accounting for £66.6 billion, around 85% of total UK outbound spending.
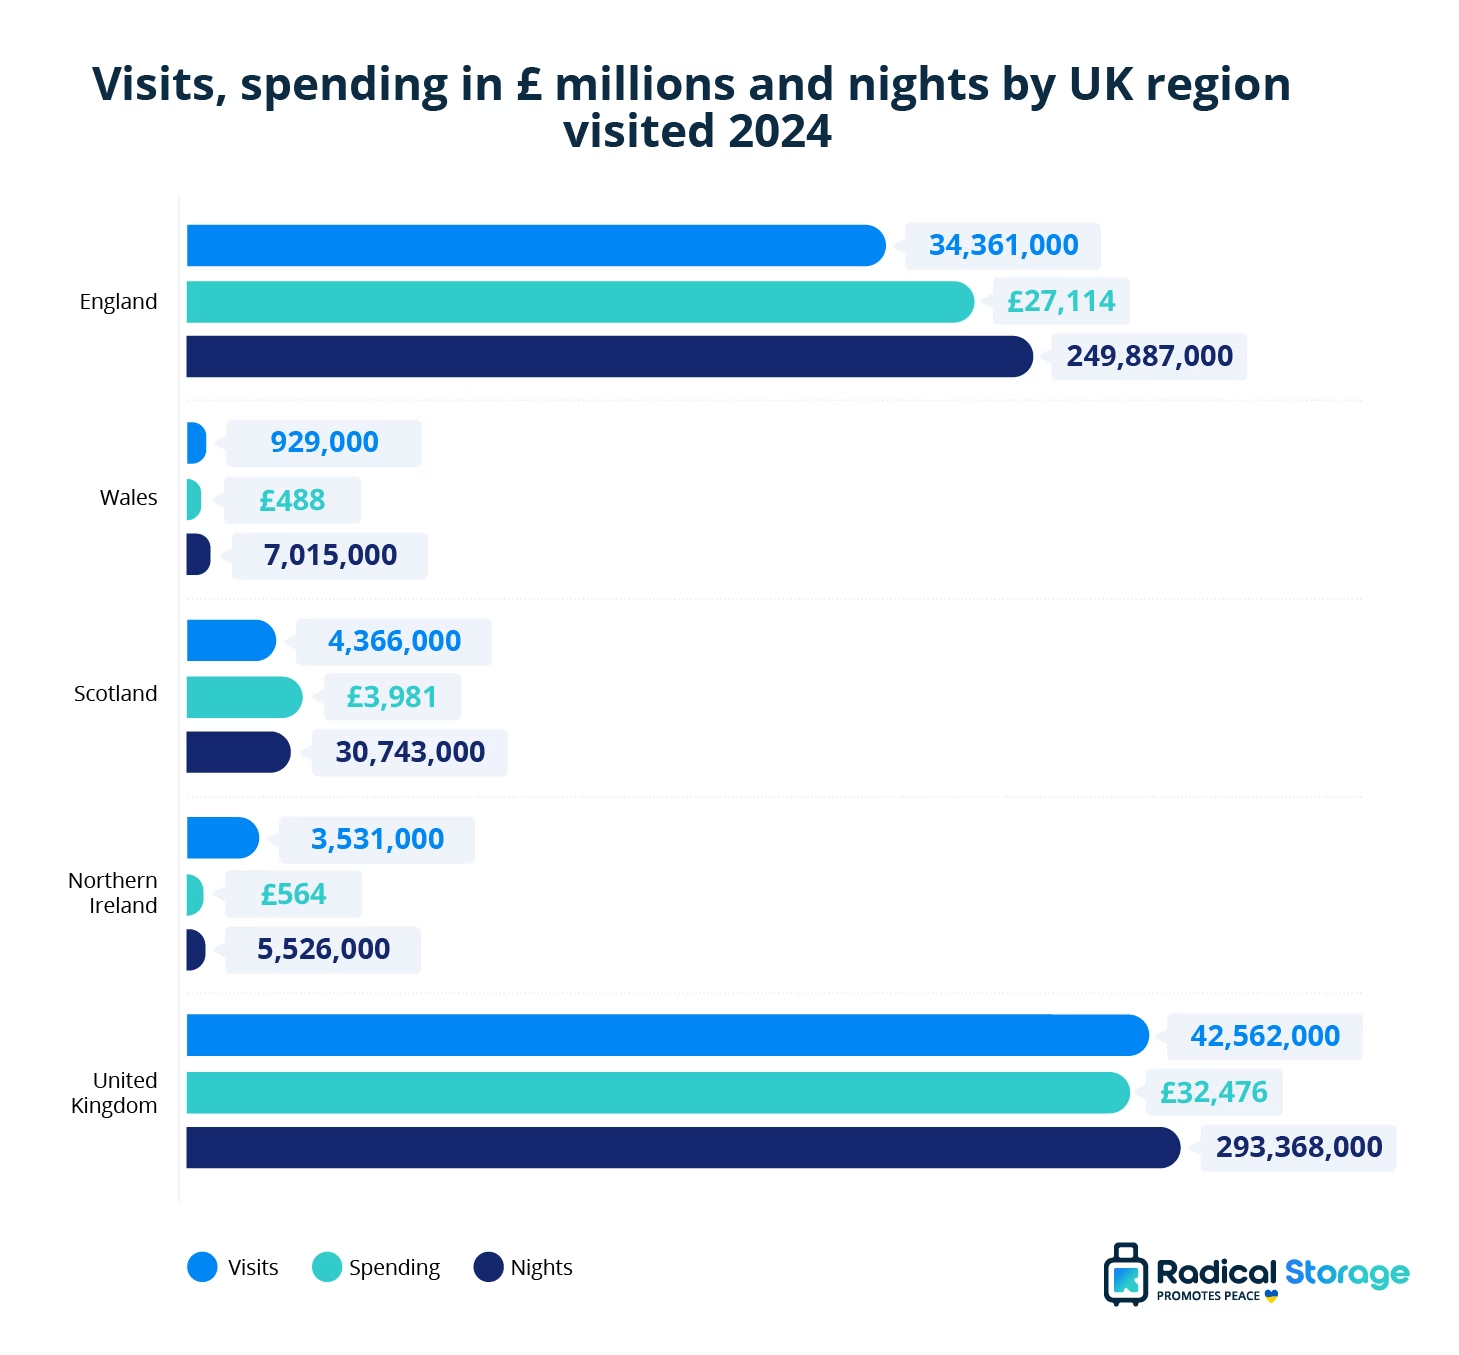
- Inbound visitors to the UK spent £32.5 billion in 2024, with Scotland emerging as the strongest-performing destination outside England in both total spend and spend per visit.
- Northern Ireland and Wales show contrasting visitor patterns: Northern Ireland draws slightly more visits but shorter stays, while Wales attracts fewer visitors who tend to stay longer despite lower overall spending.
Average tourism expenditure of EU residents
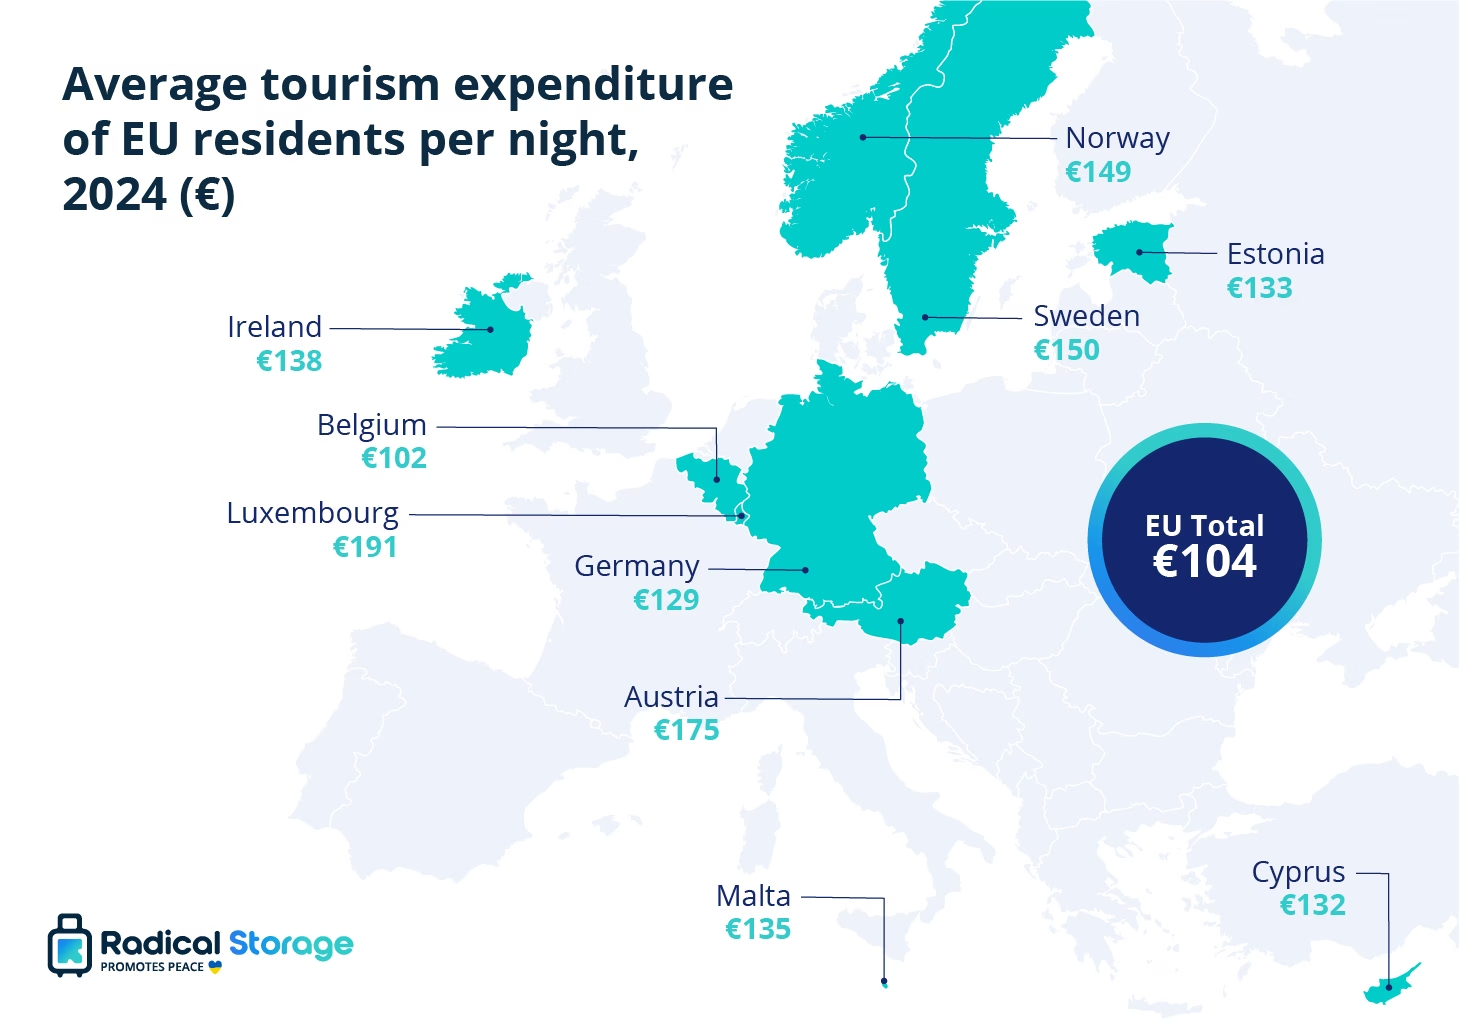
Average tourism spending among EU residents varies considerably by country of origin. Luxembourg residents spend the most by a wide margin, averaging €191 per night and €1,300 per trip, well above the EU average of €104 per night and €518 per trip.
Austria follows as the second-highest spender at an average of €175 per night. Sweden (€150), Norway (€149), and Ireland (€138) round out the top five. This puts Western, Northern, and a couple of smaller Southern European countries at the top of the table for tourist spending.
At the lower end, residents of Greece have the lowest per-night spend at just €49, well below the next-lowest countries: Czechia (€56), Poland (€60), Lithuania (€63), and Portugal (€69). Several Central and Eastern European countries, Latvia, Hungary, Bulgaria, Slovenia, also cluster in the lower-to-mid range, generally spending less per night than their Western European counterparts.
| Country of residence | Average expenditure per night (€) | Average expenditure per trip (€) |
|---|---|---|
| EU Total | €104 | €518 |
| Luxembourg | €191 | €1,300 |
| Austria | €175 | €871 |
| Sweden | €150 | €649 |
| Norway | €149 | €638 |
| Ireland | €138 | €532 |
| Malta | €135 | €687 |
| Estonia | €133 | €467 |
| Cyprus | €132 | €704 |
| Germany | €129 | €729 |
| Belgium | €102 | €787 |
| Finland | €99 | €423 |
| Netherlands | €96 | €613 |
| Slovakia | €96 | €407 |
| Slovenia | €93 | €362 |
| France | €91 | €425 |
| Italy | €86 | €533 |
| Denmark | €85 | €381 |
| Spain | €84 | €368 |
| Croatia | €83 | €442 |
| Bulgaria | €83 | €345 |
| Latvia | €77 | €266 |
| Romania | €75 | €288 |
| Hungary | €74 | €282 |
| Portugal | €69 | €284 |
| Lithuania | €63 | €241 |
| Poland | €60 | €323 |
| Czechia | €56 | €243 |
| Greece | €49 | €473 |
Source: Eurostat
Total tourism expenditure by EU country residents
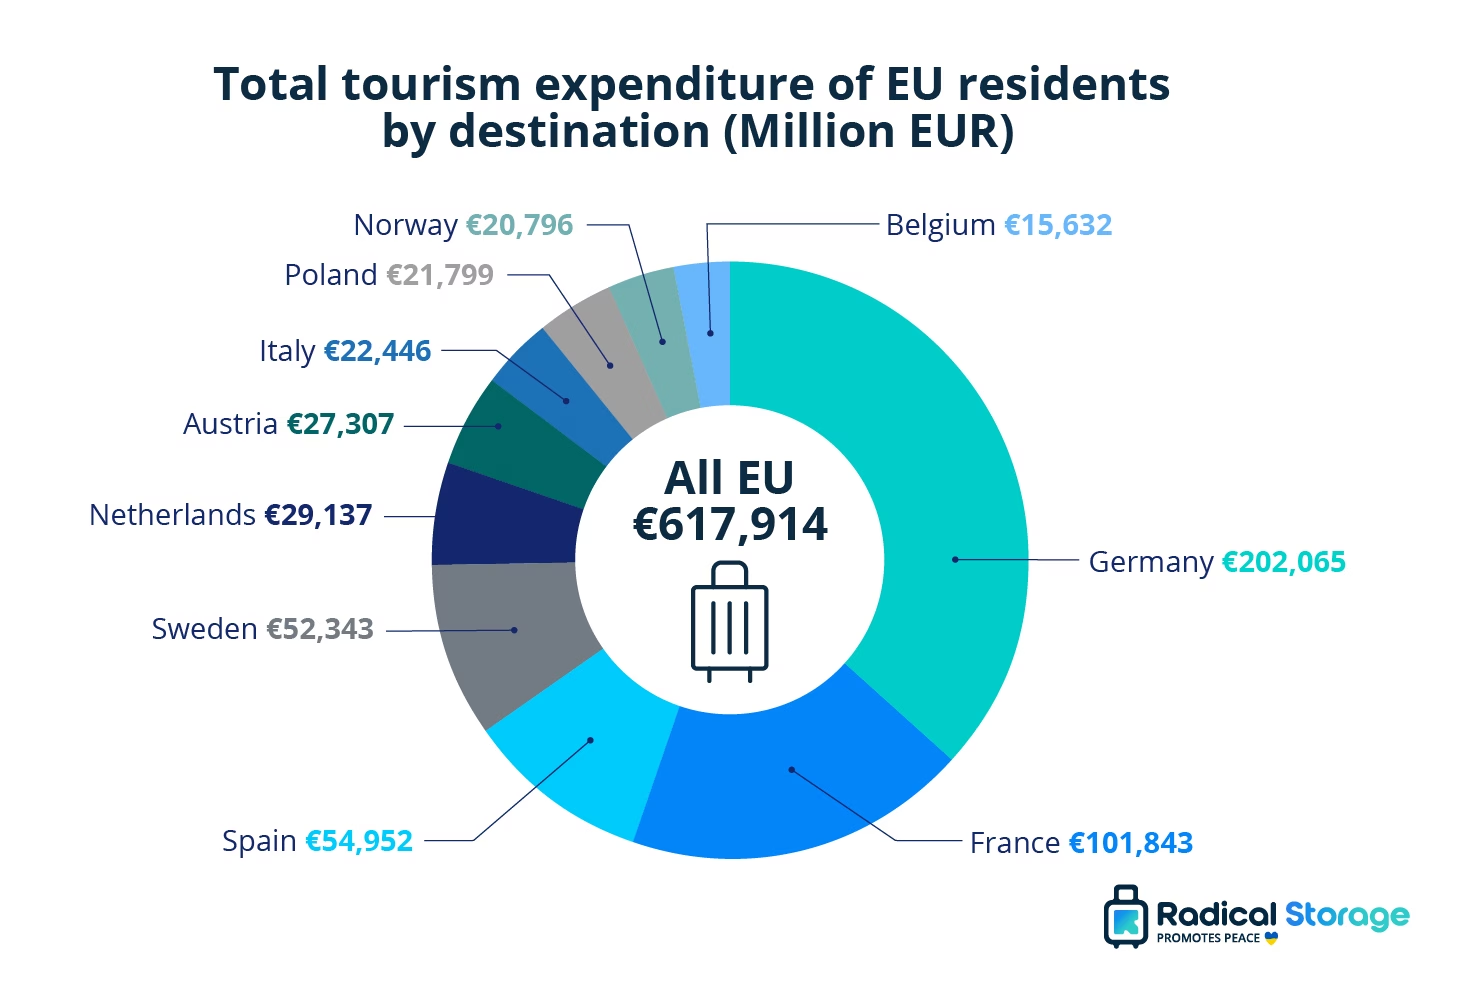
Total tourism expenditure across all EU residents reached €617.9 billion in 2024, split between €257.2 billion spent domestically and €360.7 billion spent on foreign trips.
Germany leads by a wide margin on every measure, with €202.1 billion in total spend, almost triple any other country, including €138.9 billion on foreign trips alone. Residents of France spend a total of €101.8 billion, meaning Germany and France make up almost half of total tourism expenditure across all EU residents. Spain comes third on the list with residents spending a total of €55 billion.
At the smaller end, Malta records the lowest total expenditure at €0.9 billion, with Latvia, Lithuania, Bulgaria, and Estonia also among the smallest spenders overall. This pattern is broadly tied to population size. Luxembourg stands out as a unique case: despite ranking mid-table on foreign spend (€4.2 billion), it has by far the lowest domestic expenditure (€0.06 billion), reflecting both its small size and residents’ tendency to travel abroad rather than domestically.
| Country | All trips (Million EUR) | Domestic trips (Million EUR) | Foreign trips (Million EUR) |
|---|---|---|---|
| All EU | €617,914 | €257,233 | €360,680 |
| Germany | €202,065 | €63,178 | €138,886 |
| France | €101,843 | €62,791 | €39,052 |
| Spain | €54,952 | €35,107 | €19,845 |
| Sweden | €52,343 | €26,396 | €25,947 |
| Netherlands | €29,137 | €5,289 | €23,848 |
| Austria | €27,307 | €6,962 | €20,345 |
| Italy | €22,446 | €13,441 | €9,005 |
| Poland | €21,799 | €11,335 | €10,464 |
| Norway | €20,796 | €10,423 | €10,374 |
| Belgium | €15,632 | €1,287 | €14,346 |
| Finland | €14,067 | €5,692 | €8,374 |
| Ireland | €13,558 | €3,196 | €10,362 |
| Denmark | €10,420 | €2,365 | €8,055 |
| Czechia | €7,084 | €2,301 | €4,783 |
| Romania | €6,155 | €4,512 | €1,643 |
| Portugal | €5,527 | €2,979 | €2,548 |
| Hungary | €4,991 | €1,573 | €3,418 |
| Slovakia | €4,956 | €1,593 | €3,363 |
| Luxembourg | €4,222 | €59 | €4,163 |
| Greece | €3,421 | €2,465 | €956 |
| Slovenia | €2,938 | €567 | €2,370 |
| Croatia | €2,676 | €1,403 | €1,273 |
| Cyprus | €2,371 | €300 | €2,071 |
| Estonia | €2,347 | €644 | €1,703 |
| Bulgaria | €1,836 | €1,019 | €817 |
| Lithuania | €1,661 | €483 | €1,178 |
| Latvia | €1,303 | €220 | €1,083 |
| Malta | €857 | €74 | €783 |
Source: Eurostat
Tourism spending of EU residents by destination
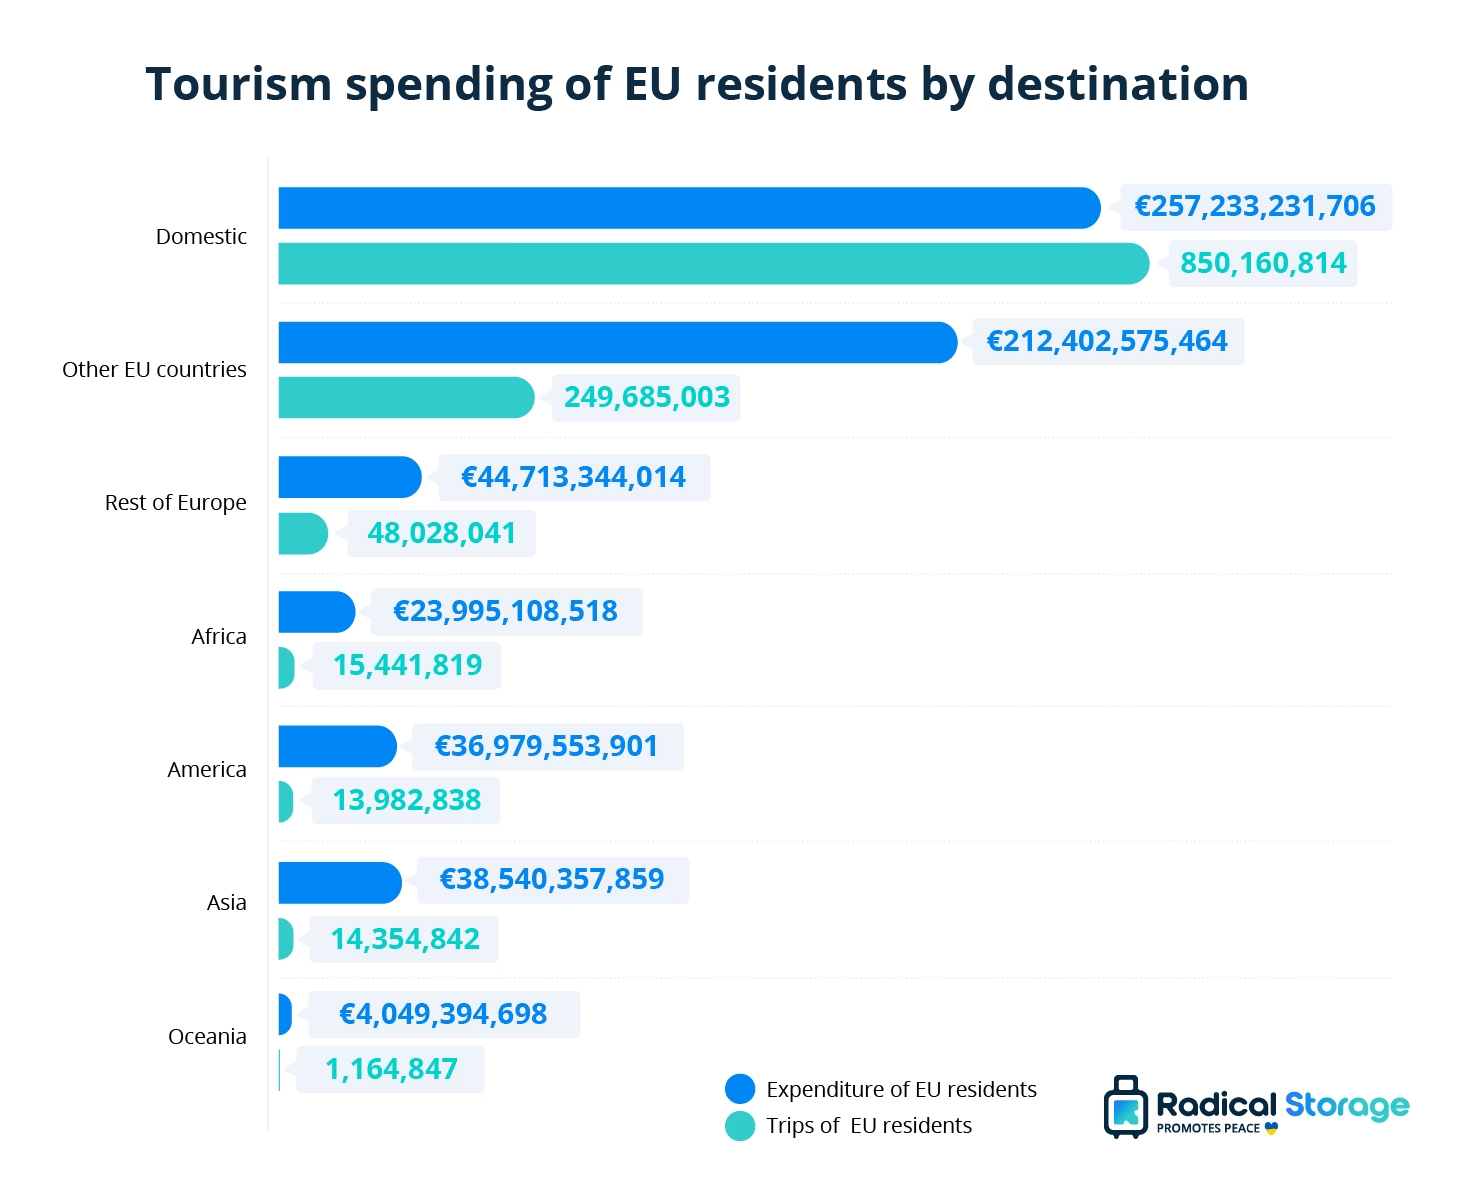
When it comes to tourist spending by EU residents in different destinations, domestic travel accounts for the largest share of trips by volume, with 850 million trips totaling €257 billion in expenditure. Travel to other EU countries is the second-largest category, generating €212 billion across 249 million trips.
Beyond Europe, Asia and America are the largest spending destinations despite relatively low trip volumes, each attracting around 13-14 million trips but generating €38.5 billion and €37 billion respectively. Africa follows at €24 billion from 15.4 million trips, while Oceania records the smallest figures overall at just 1.2 million trips and €4 billion in expenditure by EU residents.
| Destination | Expenditure of EU residents | Trips of EU residents |
|---|---|---|
| Domestic | €257.2 billion | 850.2 million |
| Other EU countries | €212.4 billion | 249.7 million |
| Rest of Europe | €44.7 billion | 48.0 million |
| Asia | €38.5 billion | 14.4 million |
| America | €37.0 billion | 14.0 million |
| Africa | €24.0 billion | 15.4 million |
| Oceania | €4.0 billion | 1.2 million |
Source: Eurostat
Average EU tourism spending by trip type
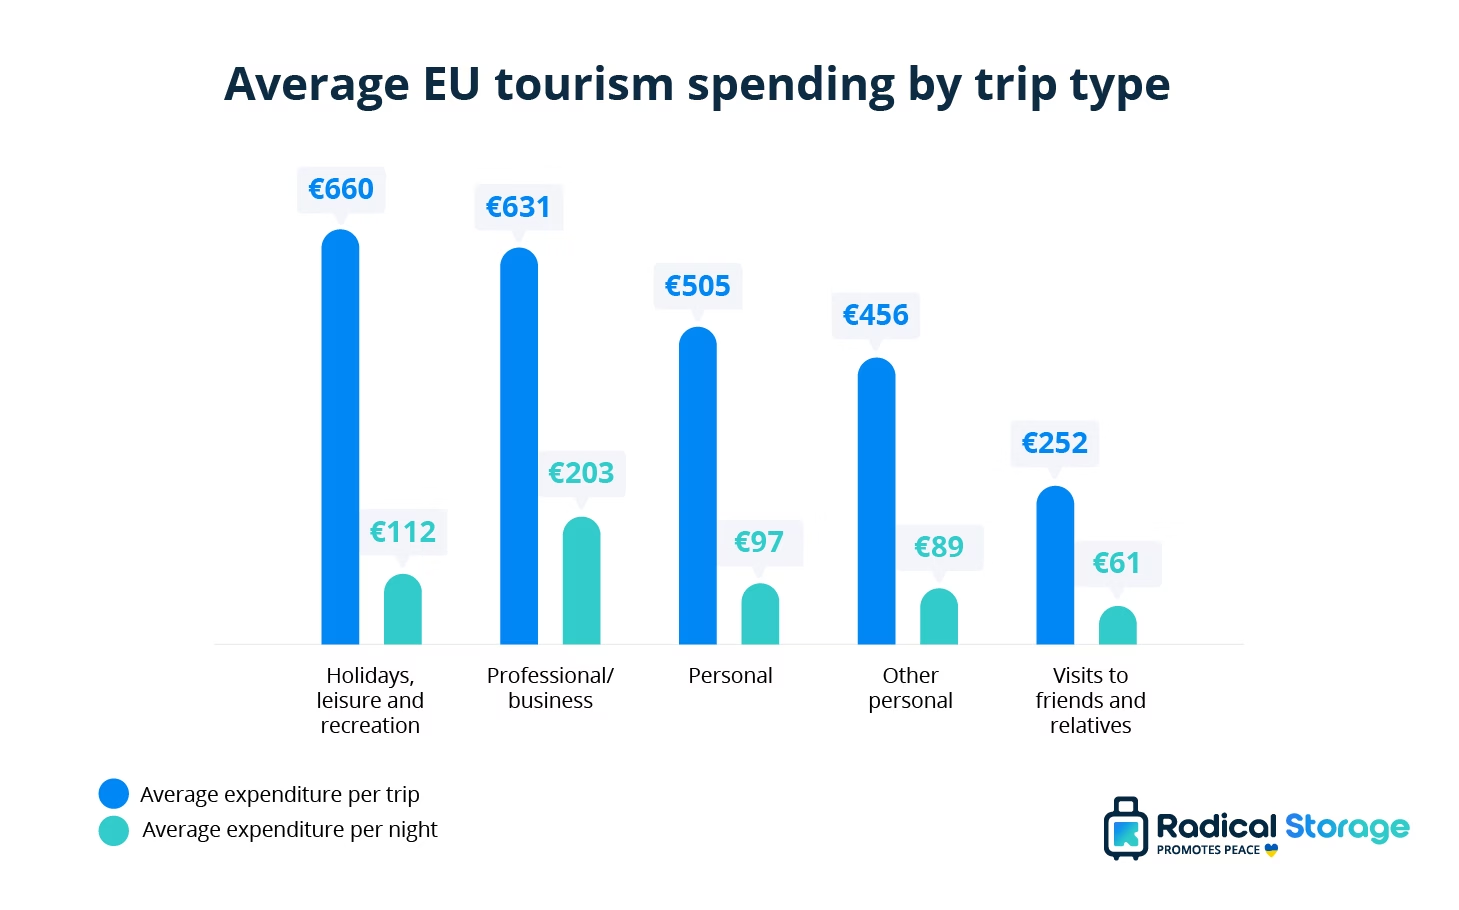
Spending varies considerably by trip purpose in the EU. Holiday, leisure, and recreation trips generate the highest average per-trip spend at €660, closely followed by professional and business travel at €631. However, business travel tops the table for per-night spend at €203, nearly double the €112 recorded for leisure trips, suggesting business travelers stay for shorter but more expensive trips.
| Trip type | Average expenditure per trip (€) | Average expenditure per night (€) |
|---|---|---|
| Holidays, leisure and recreation | €660 | €112 |
| Professional/business | €631 | €203 |
| Personal | €505 | €97 |
| Other personal | €456 | €89 |
| Visits to friends and relatives | €252 | €61 |
Source: Eurostat
UK tourism expenditure
The UK provides a useful comparison point alongside the EU figures, with travel budgets flowing in both directions: spending by UK residents traveling abroad, and spending by international visitors arriving in the UK. Breaking this down by region also reveals how that spending is distributed across England, Scotland, Wales, and Northern Ireland.
The data below covers visits, spending, and nights for both directions of travel, offering a clearer picture of where tourism money is being spent and earned within the UK.
Tourism spending by UK residents
In 2024, UK residents made 94.6 million trips abroad, spending a total of £78.6 billion across 896.5 million nights. England accounts for the overwhelming majority of this activity, with residents making 79.2 million visits, around 84% of the UK total, and spending £66.6 billion, also roughly 85% of total UK outbound spending.
Scotland is the next-largest contributor, with 6.4 million visits and £5.1 billion in spending, followed by Wales (2.8 million visits, £2.3 billion) and Northern Ireland, which records the smallest figures across all three metrics: 3.2 million visits, £1.2 billion in spending, and 15.7 million nights.
The relative ranking stays consistent across visits, spending, and nights, England, Scotland, Wales, then Northern Ireland, reflecting the population size differences between the UK’s constituent regions rather than any notable variation in travel behavior per resident.
| Region of residence | Visits abroad | Spending abroad |
|---|---|---|
| England | 79.2 million | £66.6 billion |
| Scotland | 6.4 million | £5.1 billion |
| Wales | 2.8 million | £2.3 billion |
| Northern Ireland | 3.2 million | £1.2 billion |
| United Kingdom | 94.6 million | £78.6 billion |
Source: ONS
Tourism spending by visitors to the UK
In 2024, inbound visitors made 42.6 million trips to the UK, spending £32.5 billion across 293.4 million nights. England received the vast majority of this activity, with 34.4 million visits, about 81% of the UK total, and £27.1 billion in spending, accounting for roughly 83% of total inbound spend.
Scotland was the second-largest destination by spending, drawing £4 billion from 4.4 million visits, ahead of both Wales (929,000) and Northern Ireland (3.5 million). Wales received the lowest spending of the four regions at £488 million, despite having more visitor nights (7 million) than Northern Ireland (5.5 million).
This points to a notable difference in visitor behavior: Northern Ireland sees a relatively high number of visits and spending per visit, but shorter average stays, while Wales attracts fewer, lower-spending visitors who tend to stay somewhat longer. Scotland stands out as the strongest performer outside England, both in total spend and spend per visit, suggesting it draws a higher proportion of higher-value or longer-duration visitors.
| Region visited | Visits | Spending | Nights |
|---|---|---|---|
| England | 34.4 million | £27,114 million | 249.9 million |
| Scotland | 4.4 million | £3,981 million | 30.7 million |
| Northern Ireland | 3.5 million | £564 million | 5.5 million |
| Wales | 0.9 million | £488 million | 7.0 million |
| United Kingdom | 42.6 million | £32,476 million | 293.4 million |
Source: ONS
